Most enterprise buyers now insist on proof of operational security before contracts are signed. Procurement questionnaires, security addenda, and audit clauses aren’t just paperwork, they decide whether deals progress or stall. In healthcare and regulated industries the stakes are higher because unprotected data exposes teams to regulatory penalties. According to Thomson Reuters, the global average cost of a data breach climbed to $4.88 million in 2024. IBM’s 2025 report shows it remained high at $4.44 million and that breaches taking more than 200 days to identify and contain average $5.01 million. Breach costs, reputational damage, and longer sales cycles are why leaders need rigorous SOC 2 Metrics And KPIs built into their operations. This article explains how measuring the right things supports audit readiness, risk management, and continuous improvement.
Why Metrics and KPIs Matter in Enterprise Sales
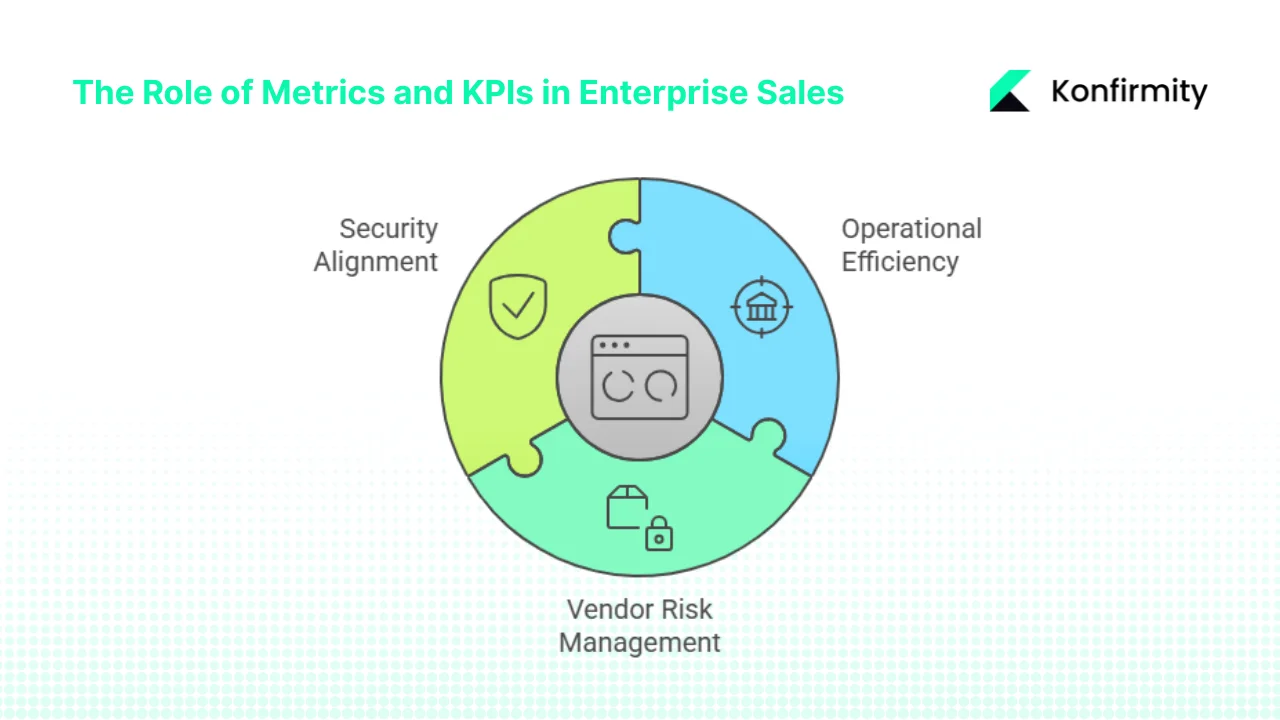
Deals with large customers often hinge on a vendor’s ability to show more than a polished report. Enterprise procurement teams want to see continuous evidence that your controls are operating, whether you follow SOC 2, ISO 27001, HIPAA, or GDPR. Metrics and KPIs measure that evidence and tie it back to operational goals. For example, tracking the mean time to detect (MTTD) and mean time to respond (MTTR) tells you how quickly your team spots and contains threats. Mean time to resolve shows how fast your organisation recovers from incidents, minimising downtime. Vendor risk also drives buyer scrutiny. One 2025 benchmark study found that 62 percent of organisations experienced supply chain disruptions caused by vendor security incidents. Without clear metrics and KPIs, it’s difficult to reassure enterprise customers that you manage third‑party risk effectively.
Metrics and key performance indicators (KPIs) also help align security functions with business outcomes. KPIs include a target or benchmark—for example, “detect critical alerts within one hour” or “complete user access reviews quarterly.” These targets create accountability and allow teams to prioritise investments. For a managed security service like Konfirmity, which has delivered more than 6,000 audits over the last decade, tying metrics back to business outcomes means clients can see how operational improvements translate into faster compliance and shorter sales cycles.
CTA: Book a demo
Understanding SOC 2, Metrics, and KPIs
SOC 2 is an attestation designed by the American Institute of Certified Public Accountants (AICPA) to demonstrate that a service organisation manages customer data responsibly. Auditors evaluate controls against the five Trust Services Criteria: Security, Availability, Processing Integrity, Confidentiality, and Privacy. Security is mandatory for every SOC 2 report, while the other criteria apply based on the organisation’s services. A Type I report evaluates controls at a point in time; a Type II report examines control effectiveness over an observation period (often 3–12 months). For companies selling to enterprise clients, a Type II report is the gold standard because it proves that controls are operating consistently.
Distinguishing Metrics, KPIs, and Controls
Metrics are raw measurements—numbers like the number of incidents per month, hours of downtime, or percentage of alerts triaged. KPIs combine those measurements with targets or benchmarks. A control is a process or technical safeguard designed to meet a requirement in a framework like SOC 2. For instance, a control might require that all user accounts be reviewed quarterly; the metric is the number of accounts reviewed on schedule; the KPI is “100 percent of accounts reviewed every quarter.”
Using a measurement framework helps teams structure metrics and KPIs across domains. For each control domain—access controls, change management, vendor management, business continuity, monitoring, and incident response—define what to measure, choose metrics, set targets, and assign ownership. This structure supports control effectiveness, risk management, data protection, and system availability.
How Metrics and KPIs Support Security Goals
Metrics and KPIs help quantify whether controls work and whether risk is decreasing. Risk management: MTTD and MTTR show how quickly you detect and contain threats. Control effectiveness: false positive and false negative rates reveal whether detection rules are tuned or whether significant threats slip through. Data protection: metrics like percentage of encrypted backups or time to revoke access demonstrate adherence to confidentiality and privacy criteria. Access controls: user access review completion rate, number of privileged accounts, and time to revoke access after a personnel change show whether least‑privilege principles are enforced. System availability: uptime percentages and mean time to recover measure how well you meet service‑level agreements. Vendor management: compliance rates of third parties and time to remediate vendor issues demonstrate supply chain resilience. Together, these metrics help teams identify gaps, prioritise improvements, and provide evidence for audits and buyers.
Core SOC 2 Metrics and KPIs You Should Track
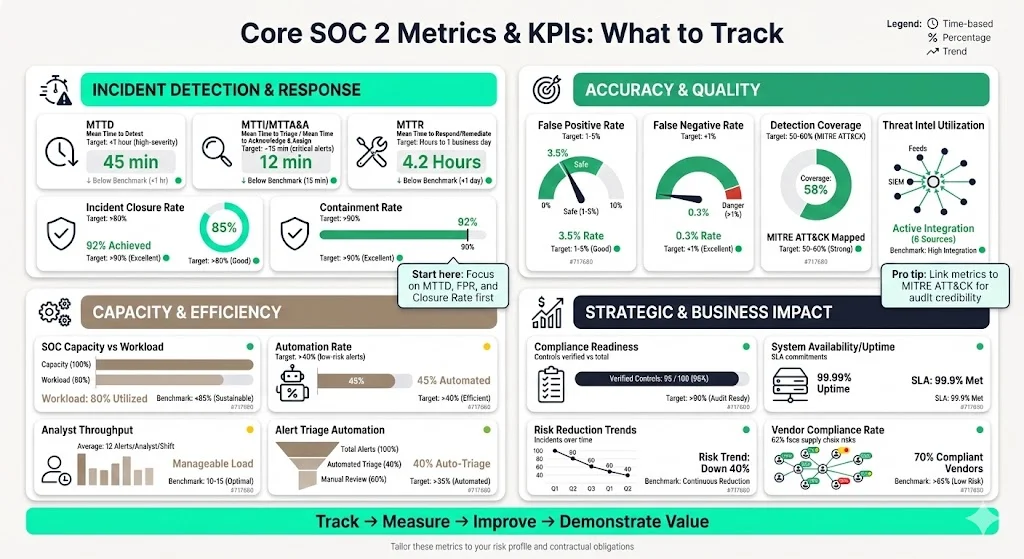
This section describes commonly used SOC 2 Metrics And KPIs, organised by category. The examples blend widely accepted practices with patterns Konfirmity has observed across thousands of engagements. Use these as a starting point and tailor them to your risk profile and contractual obligations.
Incident Detection and Response Metrics
-
Mean Time to Detect (MTTD). Average time from an incident’s occurrence to when it is detected. Short MTTD reduces attackers’ dwell time and risk. Many Konfirmity clients set a target of under one hour for high‑severity alerts.
-
Mean Time to Investigate (MTTI) / Mean Time to Attend & Analyse (MTTA&A). The average time analysts spend gathering information and triaging alerts before taking action. Dropzone AI notes that MTTI measures the time spent analysing alerts, bridging detection and response. Setting a target (e.g., 15 minutes for critical alerts) helps maintain efficiency.
-
Mean Time to Respond (MTTR). Average time from detection to containment or remediation. UpGuard emphasises that faster response minimises downtime and maintains continuity. For SaaS providers with strict SLAs, targets often range from a few hours to one business day, depending on severity.
-
Mean Time to Recover. Average time to restore service after an incident. While not unique to SOC metrics, this ties directly to availability commitments.
-
Incident Volume and Incident Closure Rate. Number of incidents detected and percentage resolved within a timeframe. UnderDefense suggests aiming for an incident closure rate above 80 percent. High closure rates indicate a disciplined incident management process.
-
Alert Escalation Rate and Containment Rate. Percentage of alerts that require escalation to higher‑tier analysts and percentage of incidents contained before causing widespread impact. A healthy escalation rate (5–20 percent) and containment rate above 90 percent are considered good benchmarks.
Accuracy and Quality Metrics
-
False Positive Rate (FPR). Proportion of alerts flagged as threats but later found benign. High FPR increases analyst fatigue; low FPR signals better detection tuning. UnderDefense recommends keeping FPR between 1 percent and 5 percent.
-
False Negative Rate (FNR) or Missed Detection Rate. Proportion of real threats that go undetected. High FNR indicates detection gaps and can only be uncovered through testing and sampling. A combined goal is to keep FNR below 1 percent.
-
Detection Coverage. Percentage of known threat techniques covered by detection rules. Wiz explains that coverage is measured against frameworks like MITRE ATT&CK; 50–60 percent coverage is considered healthy because 100 percent is unrealistic. Linking coverage metrics to control objectives helps prioritise detection engineering efforts.
-
Threat Intelligence Utilisation Effectiveness. How well the SOC integrates threat intelligence into detection and response. Low scores may indicate underused intelligence or insufficient integration.
Capacity, Efficiency, and Operational Load Metrics
-
SOC Capacity versus Workload. A ratio of available analyst hours to expected incident volume. Tracking this helps forecast hiring needs and prevent burnout.
-
Automation Rate / Automated Response Rate. Percentage of alerts handled without human intervention. With advanced tooling, some teams achieve automation rates above 40 percent for low‑risk alerts, freeing analysts to focus on complex incidents.
-
Analyst Throughput or Cognitive Load. Average number of alerts or incidents per analyst per shift. Keeping this number manageable prevents burnout and maintains quality.
-
Automation‑specific Metrics. 7AI’s research identifies metrics such as alert triage automation rate, mean time to triage, false positive reduction, and escalation rate to humans. When applying machine learning, track whether automation reduces MTTI and analyst workload.
Strategic and Business‑Impact Metrics
-
Compliance and Audit Readiness Metrics. Number of controls verified versus total controls, number of control failures, and proportion of overdue evidence requests. Tracking these across access controls, change management, vendor management, business continuity, and data protection ensures readiness for audits and enterprise due‑diligence.
-
Business Continuity and System Availability Metrics. Uptime percentages, mean time to recover, and success rates of backup/restore drills. These metrics support SLA commitments and the SOC 2 Availability criterion.
-
Security Posture and Risk Reduction Trends. Over time, track the number of incidents, severity levels, repeated control violations, and unresolved findings. Varonis reports that detection and escalation activities account for $1.47 million per breach on average. Tracking reductions in incident counts and severity over months shows whether investments yield returns.
-
Vendor Compliance Rate and Third‑Party Risk Metrics. Percentage of vendors with up‑to‑date compliance documentation, time to remediate vendor vulnerabilities, and number of vendor‑related incidents. Given that 62 percent of organisations experienced supply chain disruptions in 2025, these metrics are critical for enterprise sales.
Building a SOC 2–Ready Metrics and KPI Framework: Step‑by‑Step
Konfirmity has built and operated hundreds of SOC programs. The following process, distilled from that experience, helps teams create a structured measurement framework.
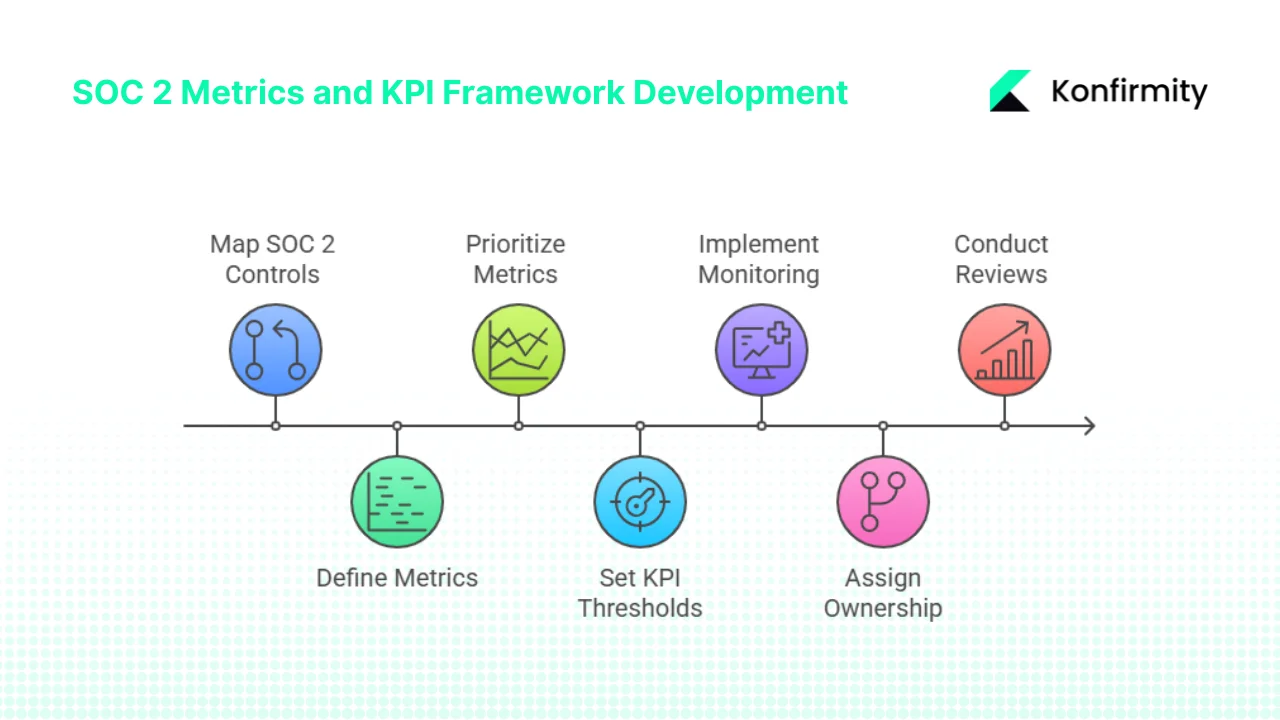
1. Map SOC 2 Control Requirements to Operational Processes
Start by understanding which Trust Services Criteria apply to your organisation. For each criterion—Security, Availability, Processing Integrity, Confidentiality, and Privacy—list the controls needed. In a SaaS context, these include: access control management (onboarding/offboarding, least privilege, user access reviews), change management (code reviews, deployment approvals), vendor management (due diligence, security clauses in contracts), business continuity (disaster recovery plans, backup and restore tests), data protection (encryption, key management), and monitoring and incident response.
Next, map each control to an operational or technical process. For example, change management controls map to your pull‑request workflows, production deployment process, and configuration management tools. Vendor management controls map to your procurement process, vendor risk assessments, and contract templates. Mapping ensures that metrics tie directly to daily activities rather than being abstract checklists.
2. Define What to Measure for Each Control
For every control domain, identify the critical events or data points. Examples include:
-
Access controls: number of privileged accounts, percentage of user access reviews completed on schedule, time to revoke access after termination.
-
Change management: percentage of changes with documented approvals, ratio of emergency changes, number of unapproved changes detected by source‑control hooks.
-
Vendor management: number of vendors assessed, compliance score per vendor, average time to complete vendor risk assessments.
-
Monitoring and incident response: MTTD, MTTI, MTTR, incident volume, false positive and negative rates, alert escalation rate.
-
Business continuity: percentage of systems covered by backup, restore success rate, mean time to recover after test events.
3. Create Metrics and Prioritise Them
Once you know what to measure, list potential metrics. Start with the core SOC 2 Metrics And KPIs described earlier and add control‑specific measurements. Don’t attempt to track everything; choose metrics that provide insight into detection, response, prevention, compliance, quality, and capacity. A good starting point for busy teams is 5–10 metrics.
4. Set KPI Thresholds and Targets
Define what success looks like for each metric. Use industry data, internal baselines, or client expectations. For instance:
-
MTTD for critical alerts < 1 hour.
-
MTTR for high‑severity incidents < 4 hours.
-
FNR < 1 percent; FPR between 1–5 percent.
-
Detection coverage > 60 percent.
-
Incident closure rate > 90 percent.
KPIs should align with business needs such as service‑level agreements, regulatory deadlines, audit cycles, and enterprise buyer expectations. For example, a healthcare SaaS provider might set a privacy incident response time of under 48 hours to meet HIPAA breach notification requirements.
Security metrics that close enterprise deals, not just satisfy auditors.
Share your work email and build a KPI framework that proves your security posture.
5. Implement Monitoring, Reporting, and Dashboards
Collect data through logging, security information and event management (SIEM), identity and access management (IAM) systems, ticketing tools, and vendor risk platforms. Automate collection where possible to avoid manual spreadsheets. Then build dashboards for real‑time monitoring and periodic reporting. Operational dashboards show daily and weekly metrics for analysts (e.g., open alerts, MTTD, MTTR), while executive dashboards summarise monthly trends and compliance status for leadership. Use templates like the one below to structure your dashboard:
| Metric | Definition | Data Source | Current Value | Target/Threshold | Owner | Last Review Date | Notes |
|---|---|---|---|---|---|---|---|
| Mean Time to Detect | Average time to discover incidents | SIEM | 30 mins | <1 hr | SOC Lead | 1 Nov 2025 | Trending downward |
| False Positive Rate | Percentage of benign alerts | SIEM | 4 % | 1–5 % | Detection Analyst | 31 Oct 2025 | Improved after tuning |
| Detection Coverage | Percentage of MITRE ATT&CK techniques covered | Detection Engineering | 55 % | >60 % | SOC Manager | 31 Oct 2025 | Increase coverage of privilege escalation |
| Vendor Compliance Rate | Percentage of vendors with up-to-date SOC 2/ISO 27001 evidence | VRM platform | 92 % | ≥95 % | Vendor Risk | 15 Oct 2025 | Work with cloud provider |
We’ve also created a mock dashboard image to visualise how these metrics could appear in a weekly operations review:
6. Assign Ownership and Accountability
Specify who is responsible for collecting, reviewing, and acting on each metric. For example, the SOC lead might own MTTD and MTTR metrics, while the vendor risk manager owns vendor compliance rates. Clear ownership ensures metrics translate into action.
7. Run Periodic Reviews and Continuous Improvement Cycles
After each incident or quarterly review, feed outcomes back into your metrics. Post‑incident reviews should identify root causes, update detection rules, and adjust thresholds. Conduct quarterly or semi‑annual KPI reviews to make sure metrics remain relevant as your environment changes and as new threats emerge. This continuous improvement approach aligns with Konfirmity’s managed service model: we operate controls year‑round, update detection coverage regularly, and refine metrics with each audit cycle.
Real‑World Examples of SOC Metrics in Practice
Example 1: Mid‑Size SaaS Company Selling to Enterprise Clients
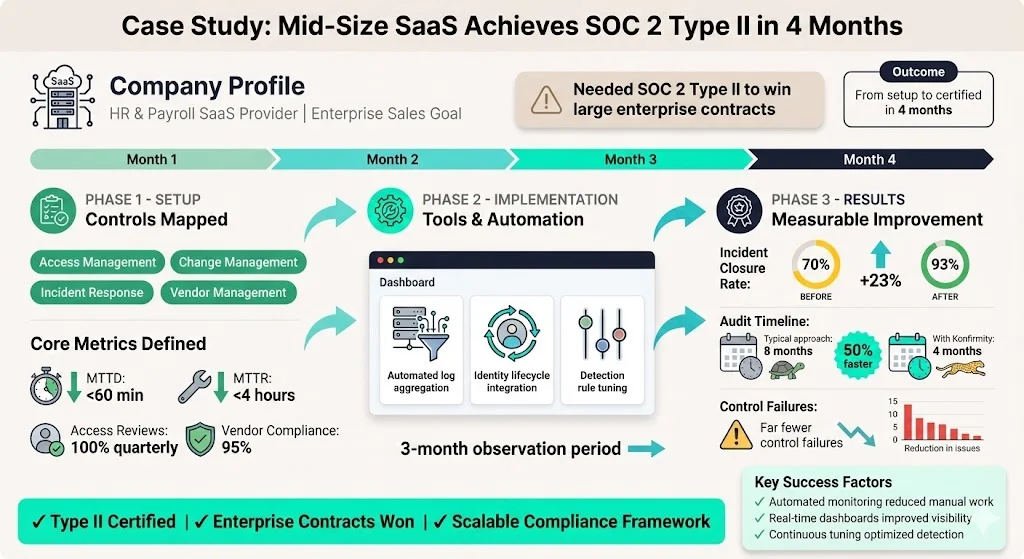
A SaaS provider offering HR and payroll services needed to achieve SOC 2 Type II to win large enterprise contracts. Konfirmity mapped their controls across access management, change management, incident response, and vendor management. We defined a handful of core metrics and KPIs: MTTD under 60 minutes, MTTR under 4 hours, quarterly access review completion at 100 percent, and vendor compliance rate at 95 percent. During the observation period, the team used automated log aggregation to track MTTD and MTTR and integrated identity lifecycle data into dashboards. Incident closure rates improved from 70 percent to 93 percent over three months as the team tuned detection rules. The company completed its Type II audit in four months, about half the time of a typical self‑managed approach, with far fewer control failures.
Example 2: AI‑Enhanced Security Operations
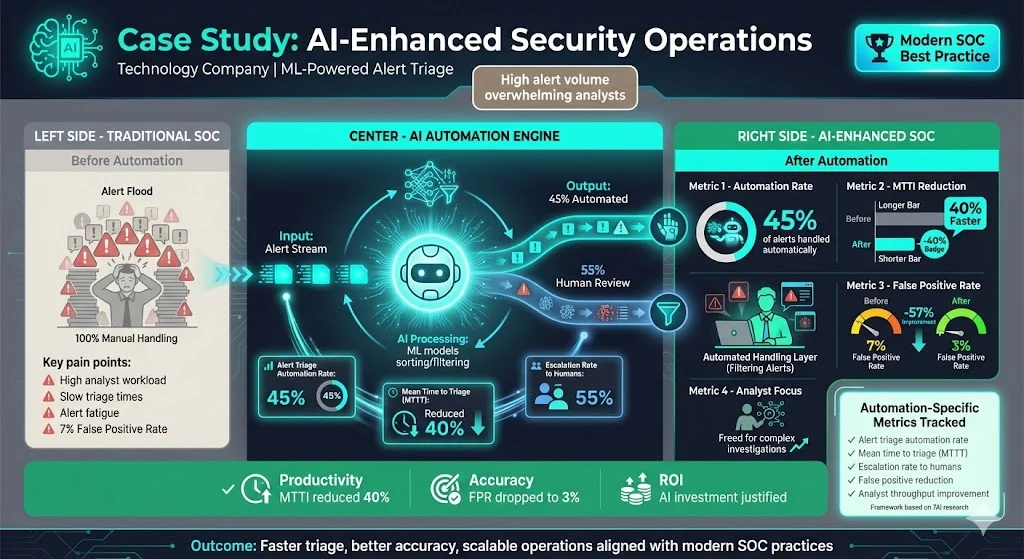
A technology company adopted automation and machine learning to triage low‑risk alerts. We expanded the measurement framework to include alert triage automation rate, mean time to triage (MTTT), and escalation rate to humans. 7AI describes how automation reduces triage time and improves analyst productivity. In this program, about 45 percent of alerts were handled automatically, reducing MTTI by 40 percent and allowing analysts to focus on complex investigations. The false positive rate dropped from 7 percent to 3 percent as machine‑learning models improved. Tracking these automation‑specific metrics helped justify investment in AI tooling and aligned the program with modern SOC practices.
Example 3: Vendor Management and Third‑Party Risk
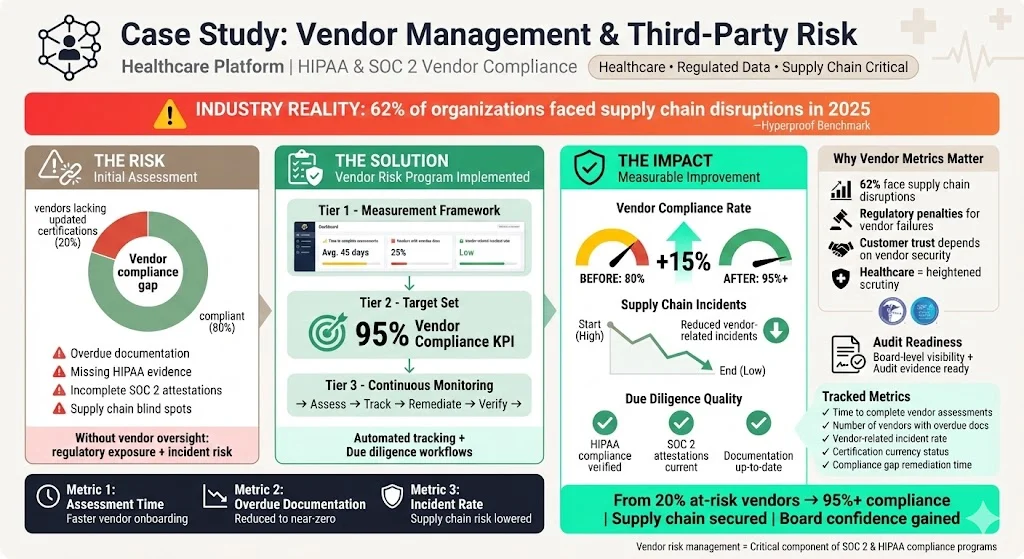
A healthcare platform required evidence that its vendors met HIPAA and SOC 2 standards. Konfirmity set up a vendor risk management program that measured time to complete vendor assessments, number of vendors with overdue documentation, and vendor‑related incident rate. Early metrics showed that 20 percent of vendors lacked updated certifications. By setting a KPI of 95 percent vendor compliance, the organisation improved vendor due diligence and reduced supply chain incidents. The industry benchmark showing that 62 percent of organisations had supply chain disruptions helped the board appreciate the urgency of vendor risk metrics.
Mock Dashboard Example
The mock dashboard image above demonstrates how a weekly operations meeting might summarise detection, response, quality, and vendor metrics. For example, the team can see that MTTD is 30 minutes against a one‑hour target, MTTR is 2 hours, the false positive rate is 4 percent, detection coverage is 55 percent, and vendor compliance is at 92 percent. A simple visual summary helps leaders quickly identify where to focus resources.
Common Pitfalls and How to Avoid Them
-
Focusing only on time‑based metrics. MTTD and MTTR are important, but measuring quality (false positives and false negatives) and coverage is equally crucial. Without FPR and FNR metrics, a team may respond quickly but still miss critical threats.
-
Tracking too many metrics. An overloaded dashboard becomes unmanageable and distracts from the metrics that matter most. Start with a handful tied to your top risks and expand gradually.
-
Misaligning metrics with business objectives. Metrics need to reflect contractual SLAs, regulatory obligations, and enterprise buyer expectations. Setting an arbitrary target without understanding stakeholder needs leads to wasted effort.
-
Relying solely on tools. Automation and AI help, but human judgement, periodic reviews, and governance remain essential. UnderDefense emphasises that false negatives can only be discovered through red‑team exercises and manual sampling.
-
Ignoring baselines and trends. One‑time measurements tell little. Instead, track metrics over months to identify improvements or regressions. Use historical data to set realistic targets and to demonstrate maturity to auditors and clients.
Practical Tips for Busy Teams
-
Start small. Identify 5–10 SOC 2 Metrics And KPIs that directly map to your control priorities and business risks. Focus on those before expanding.
-
Use existing tools. Leverage SIEMs, logging pipelines, identity management, and ticketing tools to collect data. Avoid building manual processes from scratch.
-
Automate collection and reporting. Use dashboards and alerts to track metrics in real time. Automation reduces manual overhead and ensures data is always current.
-
Assign clear ownership. Each metric should have an owner who monitors, reviews, and leads remediation actions.
-
Review and adjust regularly. As your environment or business needs change, refine metrics and targets. Use results to drive actions—tune detection rules, invest in training, or improve vendor controls.
Konfirmity’s managed service model helps teams achieve these goals by integrating metrics into daily operations. Our clients often reduce internal effort from several hundred hours to under 100 hours annually, while achieving SOC 2 Type II readiness in 4–5 months compared with 9–12 months in a self‑managed approach.
CTA: Book a demo
Conclusion
For organisations selling to enterprise and healthcare clients, continuous measurement is not optional. SOC 2 Metrics And KPIs are the tools that transform compliance from a yearly project into a daily practice. They demonstrate audit readiness, reduce risk, improve operational efficiency, and build trust with buyers. As threat actors evolve and frameworks update, treat your metrics and KPIs as living tools. Start with clear definitions, tie them to real controls, set meaningful targets, and refine them over time. Security that reads well on paper but fails in practice invites incidents and lost business. When you build controls that operate daily and track their effectiveness through well‑chosen metrics, compliance follows naturally, and your enterprise customers see a partner they can trust.
FAQs
1) What are the five principles of SOC 2?
SOC 2 is built around five Trust Services Criteria defined by the AICPA: Security, Availability, Processing Integrity, Confidentiality, and Privacy. Security is mandatory for all reports, while the other criteria apply based on the services provided. These principles guide control design and align metrics to specific goals—availability metrics for uptime, integrity metrics for change management, confidentiality metrics for encryption and access control, and privacy metrics for handling personal data.
2) What are the four critical SOC 2 KPIs?
Common KPIs include:
-
Mean Time to Detect (MTTD). Measures how quickly threats are detected; shorter times reduce exposure.
-
Mean Time to Respond (MTTR). Measures how quickly incidents are contained and remediated; helps minimise downtime.
-
False Negative Rate (FNR). Measures missed threats; keeping FNR low ensures detection coverage.
-
Incident Closure Rate or Automated Response Rate. Measures how efficiently incidents are resolved or handled through automation. A high closure rate (>90 percent) demonstrates operational effectiveness.
3) How do you measure SOC performance?
Measure SOC performance by defining metrics aligned to controls, collecting data automatically, setting targets, building dashboards, and reviewing trends. Track detection speed (MTTD), investigation efficiency (MTTI), response speed (MTTR), quality metrics (FPR, FNR), capacity metrics, and strategic metrics like compliance completion rates. Regularly review metrics and adjust controls or resources based on findings.
4) What is the difference between metrics and KPIs in security operations?
Metrics are raw measurements, such as the number of incidents or average response time. KPIs add context by setting a target or benchmark—for example, “MTTR < 4 hours.” Metrics provide data; KPIs define whether the data meets expectations. Both are essential: metrics inform, KPIs drive action and accountability.